I rebuilt our support metrics architecture three times. Here's why.
If Power BI on top of your ERP is slow or gives numbers you don't trust, Power BI is rarely the problem. What I learned building the same system three times.
If your report takes minutes to open, if two reports give different numbers for the same thing, or if every new question from management ends up as yet another spreadsheet, the problem is rarely Power BI. It is how the data underneath is set up.
I say this because I have been through it. On an internal project, a support department wanted to know where its team’s time was going. Before it worked the way it should, I had changed the architecture three times.
A simple question with many dimensions
“Where does the time go?” sounds like a question for one report. In practice, management wanted to see it per consultant, per subject area, per customer and per project, to separate first-line support from the more complex cases, to compare quarters and to track SLAs. Every month, across more than ten years of history.
Every business has its own version of that question. For a distributor it is “which customer actually makes us money”. For a warehouse, “where do orders get stuck”. The difficulty is the same: many dimensions, years of history, and numbers you need to be able to trust.
First attempt: everything inside Power BI
I started where almost everyone starts. I connected Power BI directly to the issue tracker’s API and wrote every calculation inside the report.
With a few months of data it was fine. With the full history, close to a million records, every refresh took around ten minutes, Power Query kept collapsing, and the API simply could not handle that many requests.
That is where I learned the first lesson: Power BI is excellent at showing data. It is not built to collect it from an API every time someone hits refresh.
Second attempt: I moved the data out
I wrote a .NET ETL that pulled the data on a schedule and stored it in our own SQL database. Power BI now read from there.
The API stopped being the problem. The report, though, was still slow, and it took me a while to see why. The data landed in the database raw, so all the heavy calculations still happened inside the report, across millions of rows.
I had moved the data. I had not organised it.
Third attempt: the calculations went where they belong
The fix was a data model in SQL Server Analysis Services. Relationships, hierarchies and calculations are defined there once, and Power BI simply asks.
Reports opened and answered. Just as important, every metric now had one definition in one place. When someone asked “how exactly do we measure resolution time?”, there was one answer, not one per report.
And then the system changed
Shortly after everything settled, the team moved to Jira. Different fields, different workflows, different logic. My model was built on the structure of the old system, so it did not carry over.
This time I did not patch it. I rebuilt it so that it depends on no single source. A Python pipeline now collects data from Jira and the other sources into one data warehouse, and the team manages it from an internal platform.
The result? The team sees clearly where its time goes, per customer and per project. And when someone disputes how much time a case took, the answer is data, not an estimate.
What it looks like when it is set up right
If I were starting from scratch today, I would go straight to this shape:
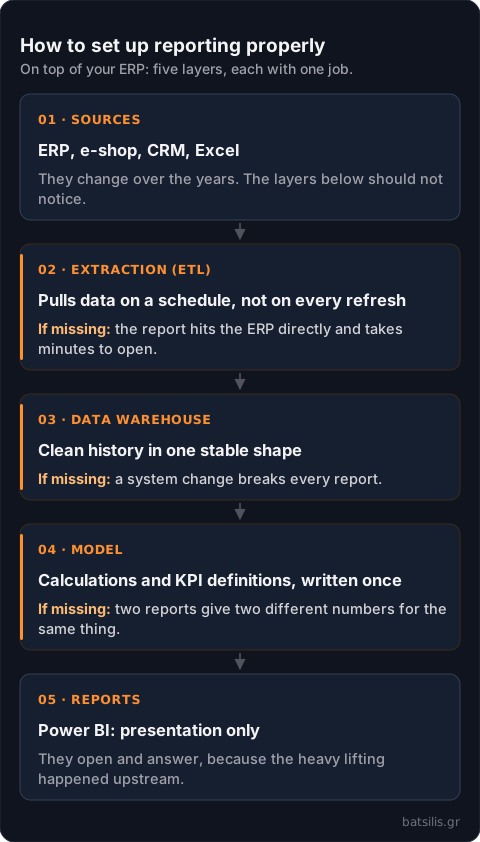
For a small or mid-sized business this does not need to be heavy. Usually a small SQL database, a scheduled ETL and a well-built model inside Power BI itself are enough; the Power BI model runs on the same engine as Analysis Services. I would keep the ETL as an independent service, for example a small .NET Web API, with its own management and proper access rights.
The tools are not the point. The point is that each layer can change without bringing down the others. If you switch ERP tomorrow, you rewrite the extraction. Your reports never notice.
Where are you right now?
The symptoms usually tell you which layer is missing:
- The report is slow to open or the refresh “hangs”. Data is pulled straight from the ERP on every refresh. Extraction is missing.
- Two reports give different numbers for the same thing. Each report has its own calculations. A shared model is missing.
- Every new question from management means a new spreadsheet. The data is not organised so it can be combined freely: customer with product, product with period, period with salesperson.
- You are afraid to change ERP because “the reports will be lost”. The reports are tied to the source’s structure. A data warehouse is missing.
None of these necessarily needs a big project to fix. It needs you to know where the problem is before you start building, so you do not have to build it three times, as I did.
If you recognised any of these in your own reports, tell me which system you use and what you want to see. I will tell you where you stand and what the next step needs.